
Page 117 - RIVER - CATALOGO 2022 - DELLAFIORE
P. 117
È molto importante che i fori per l’aria del dispositivo antisifonico siano lasciati liberi. Nel modello da incasso possono essere otturati
dalla calce, in questo caso l’erogazione è ridotta e possono apparire macchie di umidità sulla parete – in dotazione protezione per
le opere in muratura. Con pressioni elevate se dai fori del dispositivo antisifonico esce acqua durante il funzionamento significa che
è maggiore la quantità d’acqua erogata dal flussometro di quanta è scaricata dal vaso. È necessario quindi aumentare la possibilità
di scarico del vaso (tubo di scarico di Ø insufficiente) oppure con il rubinetto d’arresto regolare l’alimentazione del flussometro. Se
installati in batteria, per un calcolo approssimativo ma rapido del Ø delle tubazioni, consultare la tabella seguente considerando
prima il coefficiente di contemporaneità – se la portata di acqua è insufficiente è necessario creare un polmone di accumulo.
It is very important to keep the device’s air holes clear. They are liable to become clogged up with lime in the recessed model, this greatly reduces the flow
and damp patches may appear on the wall. If a series of units are installed, look at the table below to make a rough but rapid calculation of the required pipe
Ø and also take before of the simultaneous use coefficient - supplied protection for masonry works - if the water flow rate is insufficient it is necessary to
create an accumulation lung. TEMPORIZZATI – TIMED
TABELLA DI CONTEMPORANEITÀ Simultaneous use table
flussometri
installati n° contemporaneità n° Esempio: installazione di n° 6 flussometri, la contemporaneità sarà 2.
n. flushometers simultaneous use Questa tabella può variare per caratteristiche tecniche dell’impianto e in casi parti
installed
colari come centri sportivi dove è opportuno considerare una frequenza di utilizzo
1 - 3 1 maggiore.
4 - 8 2 For example: installation of n. 6 flushometers, the simultaneous will be n. 2.
This table may vary according to the system’s technical features and in certain circumstances
9 - 18 3 such as sports centres where a greater number of flushometers will be used at any one time.
19 - 28 4
DIAMENTRO TUBO DI ALIMENTAZIONE Diameter of supply pipes
Esempio: installazione di n° 3 flussometri / 2 bar, la
n° flussometri (rif. tabella contemporaneità) contemporaneità sarà 1, tubo Ø 1”.
BAR * n. of flushometers /ref. simultaneous use table) For example: installation of n. 3 flushometers / 2 bar, the simul-
1 2 3 4 taneous will be n. 1, pipe Ø 1”.
2 1” 1” 1/4 1” 1/4 1” 1/2
* Considerare la pressione dinamica del flussome-
3 1” 1” 1/4 1” 1/4 1” 1/2 tro più sfavorito.
4 - 6 1” 1” 1/4 1” 1/4 1” 1/2 Consider the dynamic pressure of the most unfavourable
flushometer.
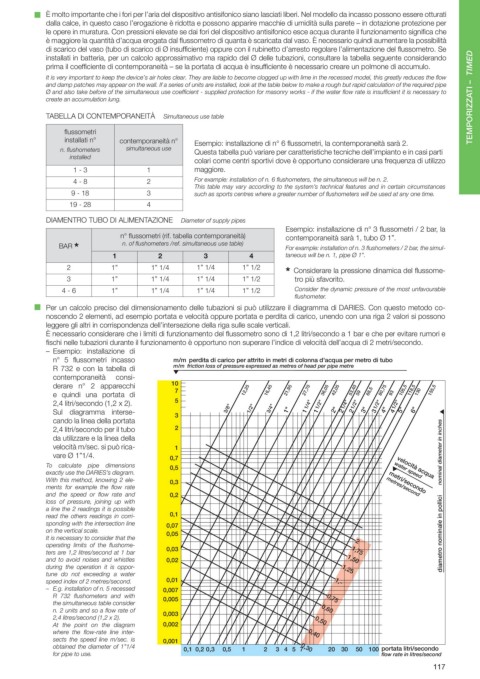
Per un calcolo preciso del dimensionamento delle tubazioni si può utilizzare il diagramma di DARIES. Con questo metodo co-
noscendo 2 elementi, ad esempio portata e velocità oppure portata e perdita di carico, unendo con una riga 2 valori si possono
leggere gli altri in corrispondenza dell’intersezione della riga sulle scale verticali.
È necessario considerare che i limiti di funzionamento del flussometro sono di 1,2 litri/secondo a 1 bar e che per evitare rumori e
fischi nelle tubazioni durante il funzionamento è opportuno non superare l’indice di velocità dell’acqua di 2 metri/secondo.
– Esempio: installazione di
n° 5 flussometri incasso m/m perdita di carico per attrito in metri di colonna d'acqua per metro di tubo
m/m friction loss of pressure expressed as metres of head per pipe metre
R 732 e con la tabella di
contemporaneità consi-
derare n° 2 apparecchi 10
7 12,25 16,45 21,95 27,70 36,05 42,05 53,40 68,5 80,75 105,5 118,5 130 155,5
e quindi una portata di 59 93
5
2,4 litri/secondo (1,2 x 2). 1/4" 1/2" 1/4" 1/2" 1/2" 1/2"
Sul diagramma interse- 3 3/8" 1/2" 3/4" 1" 1 1 2" 2 2 3" 3 4" 4 5" 6"
cando la linea della portata s e
2,4 litri/secondo per il tubo 2 h c n
da utilizzare e la linea della i n
i r
velocità m/sec. si può rica- 1 e t
e
vare Ø 1”1/4. 0,7 m a
To calculate pipe dimensions 0,5 velocità acqua i d l a
exactly use the DARIES’s diagram. water speed n i
With this method, knowing 2 ele- 0,3 metri/secondo m o
ments for example the flow rate metres/second n
and the speed or flow rate and 0,2 i
loss of pressure, joining up with c i l l
a line the 2 readings it is possible o p
read the others readings in corri- 0,1 n i
sponding with the intersection line 0,07 e l a
on the vertical scale. 0,05 n i
It is necessary to consider that the m
2 o
operating limits of the flushome- n
ters are 1,2 litres/second at 1 bar 0,03 1,75 tro
and to avoid noises and whistles 0,02 1,50 e m
during the operation it is oppor- 1,25 a i d
tune do not exceeding a water
speed index of 2 metres/second. 0,01 1,-
– E.g. installation of n. 5 recessed 0,007
R 732 flushometers and with 0,005 0,75
the simultaneous table consider
n. 2 units and so a flow rate of 0,003 0,60
2,4 litres/second (1,2 x 2). 0,50
At the point on the diagram 0,002
where the flow-rate line inter- 0,40
sects the speed line m/sec. is 0,001
obtained the diameter of 1”1/4 0,1 0,2 0,3 0,5 1 2 3 4 5 7 0,30 20 30 50 100 portata litri/secondo
for pipe to use. flow rate in litres/second
117